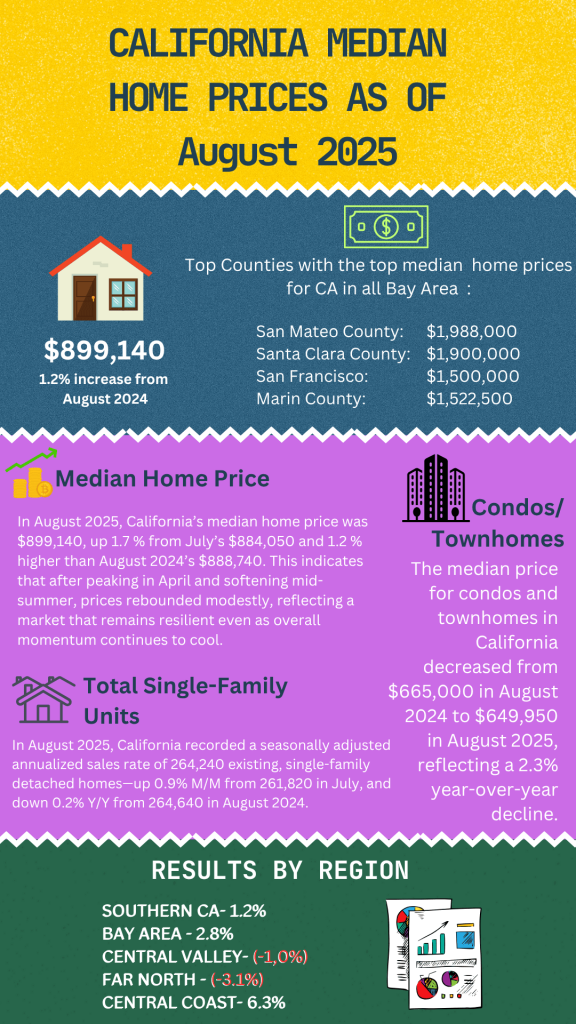
The median home price in California has reached $899,140 for August 2025 (data compiled by the California Association of Realtors – CAR). That’s a 1.2% increase, year to year, from August 2024, when the median home price in the state was $888,740. The housing market saw 264,240 existing home sales, which represents a 0.2% decrease year-over-year (YTY) and a 0.4 % decrease year-to-date (YTD). The unsold inventory index stood at 3.9 months, reflecting a 21.9% increase year-over-year. Additionally, the median number of days homes spent on the market was 31 days, a 40.9% increase from last year.
The counties with August’s highest median prices are all in the Bay Area:
- San Mateo County: $1,988,000
- Santa Clara County: $1,900,000
- San Francisco County: $1,500,000
- Marin County: $1,522,500
The counties with the next highest median prices are:
- Santa Barbara County: $1,408,650
- Orange County: $1,385,000
- Alemeda County: $1,269,000
The full breakdown by county, statewide, from CAR’s Current Sales Price and Statistics:
August 2025 County Sales and Price Activity
(Regional and condo sales data not seasonally adjusted)
| August 2025 | Median Sold Price of Existing Single-Family Homes | Sales | |||||
| State/Region/County | Aug.2025 | Jul-2025 | Aug.2024 | Price MTM% Chg | Price YTY% Chg | Sales MTM% Chg | Sales YTY% Chg |
| CA Single-family home | $899,140 | $884050 | $888,740 | 1.7% | 1.2% | 0.9% | -0.2% |
| CA Condo/Townhomes | $649,950 | $647,000 | $665,000 | 0.5% | -2.3% | -0.3% | -5.7% |
| Los Angeles Metro Area | $837,040 | $845,500 | $827,000 | -1.0% | 1.2% | -9.2% | -4.7% |
| Inland Empire | $600,130 | $589,020 | $585,260 | 1.9%2.5 | 2.5% | -4.6% | -2.8% |
| San Francisco Bay Area | $1,275,000 | $1,300,000 | $1,240,000 | -1.9% | 2.8% | -8.3% | -4.1% |
| San Francisco Bay Area | |||||||
| Alameda | $1,269,000 | $1,250,000 | $1,272,500 | 1.5% | -0.3% | -10.3% | -5.0% |
| Contra Costa | $850,000 | $862,500 | $841,950 | -1.4% | 1.0% | -4.3% | -7.5% |
| Marin | $1,522,500 | $1,625,000 | $1,450,000 | -6.3% | 5.0% | -21.9% | -3.3% |
| Napa | $975,000 | $925,000 | $976,500 | 5.4% | -0.2% | -15.2% | 1.5% |
| San Francisco | $1,500,000 | $1,637,380 | $1,528,500 | -8.4% | -1.9% | -19.6% | -1.3% |
| San Mateo | $1,988,000 | $2,100,000 | $1,900,000 | -5.3% | 4.6% | -12.8% | -1.8% |
| Santa Clara | $1,900,000 | $1,900,000 | $1,851,830 | -0.0% | 2.6% | -1.2% | -3.0% |
| Solano | $620,000 | $593,680 | $600,000 | 4.4% | 3.3% | -11.1% | -13.4% |
| Sonoma | $832,500 | $845,450 | $809,160 | -1.5% | 2.9% | -6.0% | 5.9% |
| Southern California | |||||||
| Los Angeles | $930,720 | $911,360 | $919,890 | 2.1% | 1.2% | -16.0% | -12.3% |
| Orange | $1,385,000 | $1,400,000 | $1,400,000 | -1.1% | -1.1% | -4.3% | 1.4% |
| Riverside | $625,000 | $630,000 | 618,940 | -0.8% | 1.0% | -6.2% | -7.0% |
| San Bernardino | $503,030 | $486,290 | $499,000 | 3.4% | 0.8% | -1.1% | 3.6% |
| San Diego | $1,025,000 | $1,040,000 | $1,010,000 | -1.4% | 1.5% | 1.3% | -0.6% |
| Ventura | $937,500 | $949,500 | $965,000 | -1.3% | -2.8% | -7.3% | 16.7% |
| Central Coast | |||||||
| Monterey | $1,087,150 | $1,022,500 | $900,000 | 6.3% | 20.8% | 0.7% | 4.3% |
| San Luis Obispo | $935,400 | $940,000 | $942,500 | -0.5% | -0.8% | 3.4% | 5.0% |
| Santa Barbara | $1,408,650 | $1,095,500 | $1,062,450 | 28.6% | 32.6% | -2.3% | 0.0% |
| Santa Cruz | $1,397,000 | $1,395,500 | $1,300,000 | 0.1% | 7.5% | -11.3% | -4.5% |
| Central Valley | |||||||
| Fresno | $446,390 | $440,000 | $434,940 | 1.5% | 2.6% | -7.4% | 0.4% |
| Glenn | $350,000 | $375,000 | $325,000 | -6.7% | 7.7% | 11.8% | 26.7% |
| Kern | $415,000 | $390,000 | $399,500 | 6.4% | 3.9% | -3.3% | 4.6% |
| Kings | $380,000 | $365,000 | $380,000 | 4.1% | 0.0% | 1.0% | 36.1% |
| Madera | $445,000 | $445,000 | $430,750 | 0.0% | 3.3% | -11.0% | -7.9% |
| Merced | $418,500 | $440,000 | $415,000 | -4.9% | 0.8% | 3.7% | 6.3% |
| Placer | $675,000 | $687,480 | $675,000 | -1.8% | 0.0% | -12.8% | -12.0% |
| Sacramento | $550,000 | $559,500 | $559,000 | -1.7% | -1.6% | -8.8% | -5.4% |
| San Benito | $742,500 | $799,900 | $812,500 | -7.2% | -8.6% | 8.6% | 11.8% |
| San Joaquin | $535,000 | $530,000 | $560,000 | 0.9% | -4.5% | -2.0% | -13.1% |
| Stanislaus | $499,720 | $475,000 | $475,000 | 5.2% | 5.2% | 1.8% | 0.0% |
| Tulare | $378,700 | $382,990 | $380,000 | -1.1% | -0.3% | -17.7% | -4.8% |
| Other Calif. Counties | |||||||
| Amador | $469,500 | $415,000 | $431,000 | 13.1% | 8.9% | 0.0% | -8.3% |
| Calaveras | $540,000 | $456,750 | $505,000 | 18.2% | 6.9% | -16.2% | -31.3% |
| Del Norte | $352,500 | $369,000 | $450,000 | -4.5% | -21.7% | 6.7% | 6.7% |
| El Dorado | $679,500 | $717,500 | $650,000 | -5.3% | 4.5% | 3.6% | -3.4% |
| Humboldt | $422,500 | $450,000 | $434,500 | -6.1% | -2.8% | -11.7% | -5.4% |
| Lake | $355,000 | $364,000 | $329,950 | -2.6% | 7.6% | 39.6% | 8.1% |
| Mariposa | $415,000 | $450,000 | $410,000 | -7.8% | 1.2% | -13.0% | 81.8% |
| Mendocino | $469,500 | $467,000 | $567,500 | 0.5% | -17.3% | 27.3% | 3.7% |
| Mono | $1,175,000 | $1,064,000 | $1,160,000 | 10.4% | 1.3% | 0.0% | 11.1% |
| Nevada | $560,000 | $549,500 | $560,000 | 1.9% | 0.0% | -4.5% | 8.2% |
| Sutter | $435,000 | $460,000 | $416,500 | -5.4% | 4.4% | 8.5% | 0.0% |
| Tuolumne | $435,000 | $455,000 | $420,950 | -4.4% | 3.3% | -9.5% | -4.3% |
| Yolo | $599,450 | $635,000 | $620,960 | -5.6% | -3.5% | 0.0% | -1.7% |
| Yuba | $440,000 | $440,000 | $448,000 | 0.0% | -1.8% | -22.5% | -35.3% |
| Butte | $468,000 | $456,500 | $458,000 | 2.5% | 2.2% | -24.6% | -12.8% |
| Lassen | $221,000 | $311,000 | $236,000 | -28.9% | -6.4% | 22.2% | 46.7% |
| Plumas | $480,000 | $434,500 | $547,420 | 10.5% | -12.3% | 63.3% | 22.5% |
| Siskiyou | $300,000 | $365,000 | $305,500 | -17.8% | -1.8% | 13.9% | 10.8% |
| Tehama | $335,000 | $370,000 | $380,000 | -9.5% | -11.8% | -32.1% | -24.0% |
| Trinity | $310,000 | $240,500 | $280,000 | 28.9% | 10.7% | -12.5% | 0.0% |
You May Also Like:
- 50
 12 Ways to Secure a Down Payment for Your Mortgage! If you are a first time home buyer in California (or anywhere else in the country) one of the biggest challenges could be to accumulate the necessary down payment. I have put together the most comprehensive list of possible down…
 - 49
 A Home Owner Association (HOA) can have a huge impact on your life when you buy a home in a PUD (Planned Unit Development) or Condominium Project. A homeowners' association (abbrev. HOA) is an organization created by a real estate developer for the purpose of developing, managing and selling a…
 - 47
 Even with a bit of a slowdown in 2022, there are still hot real estate markets. This post is part two of 2024 hottest real estate markets. You can click here to see the five markets in part one. The NAR picked these markets as the ten with the most potential…


