The median home price in California has reached its highest level since 2007, coming in at $522,440 for February 2018 (data compiled by the California Association of Realtors – CAR.) That’s an 8.8% increase, year to year, from February 2017, when the median home price in the state was $480,270. The peak of the market for California came in May of 2007 when the median home price was $594,530.
According to CAR “year-over-year price gain has been growing at or above 7 percent for eight of the past nine months.”

Mortgage Pre-Approval
in Minutes
The counties with February’s highest median prices are all in the Bay Area:
- San Francisco County: $1,730,000
- San Mateo County: $1,610,000
- Santa Clara County: $1,383,500
- Marin County: $1,371,000
The counties with the next highest median prices are:
- Orange County: $805,380
- Santa Cruz County: $800,000
- Santa Barbara County: $755,000
According to the National Association of Realtors (NAR) chief economist Lawrence Yun, “The very healthy U.S. economy and labor market are creating a sizeable interest in buying a home in early 2018. However, even as seasonal inventory gains helped boost sales last month, home prices – especially in the West – shot up considerably. Affordability continues to be a pressing issue because new and existing housing supply is still severely subpar.”
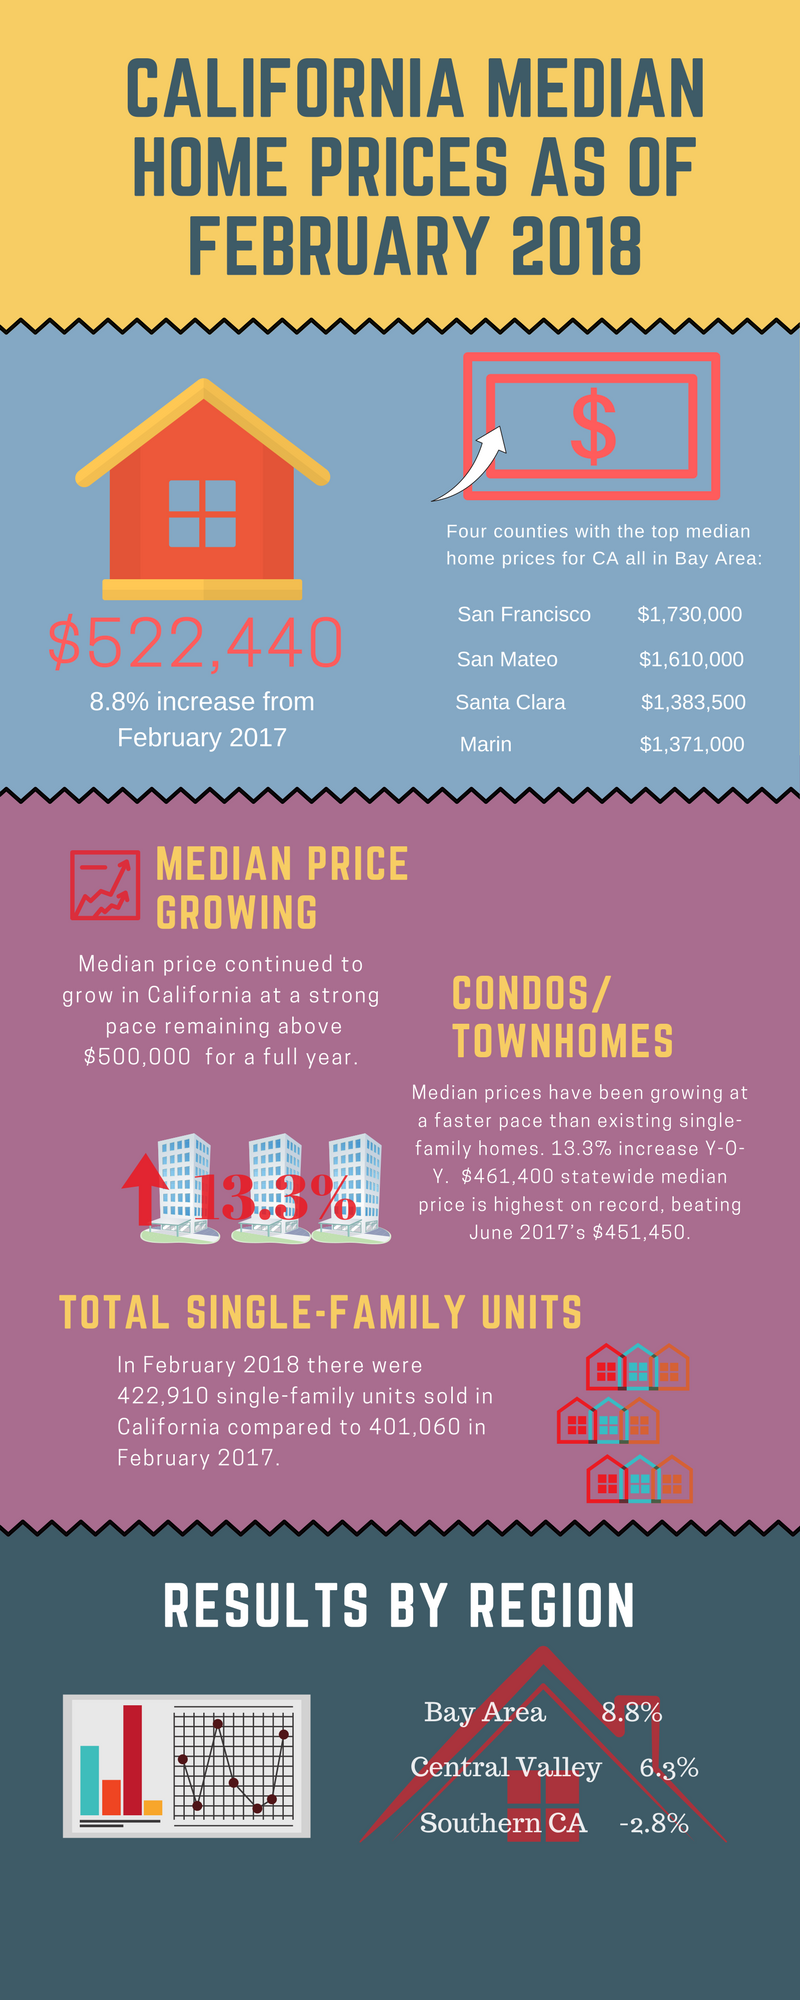
The median price for Condos/Townhomes has been growing at a faster pace than existing single-family homes, with a 13.3% increase, year over year. The $461,400 statewide median price is the highest on record, beating June 2017’s $451,450.
While shrinking inventory continues to hamper home buyers in the state, the 422,910 single-family units sold in February 2018 was a 5.4% increase from February 2017’s 401,060 single-family units. These results seem to be driven by sales in the Bay Area counties, which saw home sales surge in February as compared to Southern California where home sales continue to decline.
CAR broke down the data regionally throughout the state and noted:
- Sales increased in eight of nine Bay Area counties, with Contra Costa (11.2 percent), Napa (18.2 percent), and San Mateo (16.1 percent) all increasing by double digits.
- Central Valley also experienced an increase in sales, as the region maintained its momentum for the second consecutive month. Sales of existing single-family homes were up 6.3 percent when compared to last February.
- The Southern California market was not as robust as the Bay Area and the Central Valley with an overall sales decline of 2.8 percent when compared to last February.
- While the price growth in Southern California was not as strong as that of the Bay Area, the increase was still robust. All counties increased on a year-over-year basis by at least 4.5 percent with Los Angeles rising the most at 12.1 percent. Orange County followed with an 8.1 percent year-over-year increase, surpassing the $800,000 benchmark for the first time and setting a new record high median price ($805,380).
The full breakdown by county, statewide, from CAR’s Current Sales Price and Statistics:
February 2017 County Sales and Price Activity
(Regional and condo sales data not seasonally adjusted)
|
February 2018 |
Median Sold Price of Existing Single-Family Homes |
Sales |
|||||||
|
State/Region/County |
Feb. 2018 |
Jan. 2018 |
Feb. 2017 |
Price MTM% Chg |
Price YTY% Chg |
Sales MTM% Chg |
Sales YTY% Chg |
||
|
CA Single-family home |
$522,440 |
$527,780 |
r |
$480,270 |
-1.0% |
8.8% |
3.3% |
5.4% |
|
|
CA Condo/Townhomes |
$461,400 |
$433,160 |
r |
$407,100 |
6.5% |
13.3% |
5.5% |
-2.4% |
|
|
Los Angeles Metro Area |
$497,730 |
$492,450 |
$454,520 |
1.1% |
9.5% |
-7.3% |
-2.5% |
||
|
Inland Empire |
$352,570 |
$349,710 |
$327,440 |
0.8% |
7.7% |
-3.6% |
-1.2% |
||
|
San Francisco Bay Area |
$893,690 |
$809,900 |
$784,470 |
10.3% |
13.9% |
7.5% |
7.1% |
||
|
San Francisco Bay Area |
|||||||||
|
Alameda |
$832,000 |
$840,000 |
$786,000 |
-1.0% |
5.9% |
5.4% |
6.8% |
||
|
Contra Costa |
$610,000 |
$555,000 |
$554,250 |
9.9% |
10.1% |
0.7% |
11.2% |
||
|
Marin |
$1,371,000 |
$1,317,500 |
$1,174,500 |
4.1% |
16.7% |
1.2% |
1.2% |
||
|
Napa |
$713,500 |
$662,000 |
$660,000 |
7.8% |
8.1% |
-7.9% |
18.6% |
||
|
San Francisco |
$1,730,000 |
$1,330,000 |
$1,276,000 |
30.1% |
35.6% |
8.6% |
-4.7% |
||
|
San Mateo |
$1,610,000 |
$1,437,500 |
$1,352,000 |
12.0% |
19.1% |
30.2% |
16.1% |
||
|
Santa Clara |
$1,383,500 |
$1,170,000 |
$1,100,000 |
18.2% |
25.8% |
19.3% |
5.7% |
||
|
Solano |
$430,000 |
$425,000 |
$382,500 |
1.2% |
12.4% |
8.0% |
3.1% |
||
|
Sonoma |
$689,000 |
$670,000 |
$598,640 |
2.8% |
15.1% |
-5.5% |
3.9% |
||
|
Southern California |
|||||||||
|
Los Angeles |
$527,280 |
$564,100 |
$470,200 |
-6.5% |
12.1% |
-6.0% |
-3.9% |
||
|
Orange |
$805,380 |
$780,000 |
$745,000 |
3.3% |
8.1% |
5.0% |
-1.0% |
||
|
Riverside |
$396,250 |
$397,250 |
$367,250 |
-0.3% |
7.9% |
1.7% |
-0.8% |
||
|
San Bernardino |
$278,000 |
$277,000 |
$265,000 |
0.4% |
4.9% |
-11.2% |
-2.0% |
||
|
San Diego |
$605,000 |
$590,000 |
$559,950 |
2.5% |
8.0% |
4.7% |
-3.9% |
||
|
Ventura |
$609,000 |
$660,720 |
$582,500 |
-7.8% |
4.5% |
-17.7% |
-7.1% |
||
|
Central Coast |
|||||||||
|
Monterey |
$590,000 |
$571,500 |
$535,000 |
3.2% |
10.3% |
-8.2% |
7.7% |
||
|
San Luis Obispo |
$605,000 |
$565,000 |
$556,000 |
7.1% |
8.8% |
-21.9% |
-4.3% |
||
|
Santa Barbara |
$755,000 |
$567,000 |
$844,000 |
33.2% |
-10.5% |
1.3% |
16.7% |
||
|
Santa Cruz |
$800,000 |
$790,000 |
$799,000 |
1.3% |
0.1% |
-23.5% |
-9.3% |
||
|
Central Valley |
|||||||||
|
Fresno |
$265,000 |
$245,450 |
r |
$230,000 |
8.0% |
15.2% |
4.0% |
5.7% |
|
|
Glenn |
$219,600 |
$228,500 |
$181,500 |
-3.9% |
21.0% |
-31.3% |
-8.3% |
||
|
Kern |
$237,000 |
$225,500 |
$218,000 |
5.1% |
8.7% |
3.4% |
4.2% |
||
|
Kings |
$215,000 |
$238,000 |
$222,500 |
-9.7% |
-3.4% |
-11.1% |
-17.9% |
||
|
Madera |
$255,000 |
$275,000 |
$230,000 |
-7.3% |
10.9% |
17.6% |
-55.6% |
||
|
Merced |
$267,850 |
$257,000 |
$231,000 |
4.2% |
16.0% |
2.8% |
31.0% |
||
|
Placer |
$472,370 |
$446,000 |
$435,000 |
5.9% |
8.6% |
-0.6% |
0.0% |
||
|
Sacramento |
$350,000 |
$350,000 |
$324,900 |
0.0% |
7.7% |
0.4% |
11.4% |
||
|
San Benito |
$545,000 |
$555,000 |
$517,500 |
-1.8% |
5.3% |
-18.6% |
-7.9% |
||
|
San Joaquin |
$365,000 |
$350,000 |
$314,730 |
4.3% |
16.0% |
-4.8% |
9.4% |
||
|
Stanislaus |
$300,000 |
$295,000 |
$270,500 |
1.7% |
10.9% |
-5.9% |
-4.5% |
||
|
Tulare |
$225,000 |
$215,730 |
$216,500 |
4.3% |
3.9% |
-0.4% |
3.5% |
||
|
Other Calif. Counties |
|||||||||
|
Amador |
$318,500 |
$330,000 |
$265,000 |
-3.5% |
20.2% |
15.2% |
65.2% |
||
|
Butte |
$297,000 |
$314,750 |
$290,000 |
-5.6% |
2.4% |
0.0% |
-6.1% |
||
|
Calaveras |
$311,500 |
$306,500 |
$294,500 |
1.6% |
5.8% |
7.5% |
22.9% |
||
|
Del Norte |
$216,500 |
$198,500 |
$265,000 |
9.1% |
-18.3% |
-10.0% |
28.6% |
||
|
El Dorado |
$468,000 |
$480,000 |
$419,500 |
-2.5% |
11.6% |
-5.0% |
24.3% |
||
|
Humboldt |
$291,700 |
$300,000 |
$297,500 |
-2.8% |
-1.9% |
-7.0% |
17.6% |
||
|
Lake |
$234,500 |
$279,000 |
$230,000 |
-15.9% |
2.0% |
-7.4% |
8.7% |
||
|
Lassen |
$280,000 |
$217,750 |
$171,000 |
28.6% |
63.7% |
-35.0% |
44.4% |
||
|
Mariposa |
$357,000 |
$276,500 |
$335,000 |
29.1% |
6.6% |
37.5% |
-26.7% |
||
|
Mendocino |
$420,000 |
$425,000 |
$381,500 |
-1.2% |
10.1% |
-26.3% |
-9.7% |
||
|
Mono |
$830,000 |
$480,000 |
$520,880 |
72.9% |
59.3% |
80.0% |
50.0% |
||
|
Nevada |
$400,000 |
$382,000 |
$390,000 |
4.7% |
2.6% |
33.3% |
28.0% |
||
|
Plumas |
$261,500 |
$265,950 |
$210,000 |
-1.7% |
24.5% |
-30.0% |
16.7% |
||
|
Shasta |
$255,000 |
$249,000 |
$235,000 |
2.4% |
8.5% |
-2.6% |
7.4% |
||
|
Siskiyou |
$200,000 |
$193,000 |
$240,000 |
3.6% |
-16.7% |
-17.5% |
43.5% |
||
|
Sutter |
$283,500 |
$284,200 |
$269,120 |
-0.2% |
5.3% |
8.3% |
69.6% |
||
|
Tehama |
$189,000 |
$227,500 |
$225,000 |
-16.9% |
-16.0% |
3.1% |
73.7% |
||
|
Tuolumne |
$274,000 |
$265,000 |
$287,500 |
3.4% |
-4.7% |
-25.5% |
-14.6% |
||
|
Yolo |
$397,500 |
$383,000 |
$372,000 |
3.8% |
6.9% |
6.2% |
-4.4% |
||
|
Yuba |
$269,000 |
$265,360 |
$256,500 |
1.4% |
4.9% |
5.2% |
-11.6% |
||
You May Also Like:
- 10000Debt-to-Income (DTI) Ratio is one of the many new mortgage related terms many First-Time Home Buyers in California will get used to hearing. DTI is a component of the mortgage approval process that measures a borrower's Gross Monthly Income compared to their credit payments and other monthly liabilities. Debt-to-Income Ratios…
- 10000
") 2023 Conforming Loan Limits California is $726,200 and goes up to $1,089,300 for high-cost counties for one-unit properties. 2023 Conforming Loan Limits California for 2-unit properties is $929,850 and goes up to $1,394,775 for high-cost counties. What is Conforming Loan Limit? Conforming loans are loans that follow guidelines from Government…
2023 Conforming Loan Limits California is $726,200 and goes up to $1,089,300 for high-cost counties for one-unit properties. 2023 Conforming Loan Limits California for 2-unit properties is $929,850 and goes up to $1,394,775 for high-cost counties. What is Conforming Loan Limit? Conforming loans are loans that follow guidelines from Government… - 10000
 Both Fannie Mae are Freddie Mac, the two agencies that purchase conforming loans, are going to charge additional fees thus making 2nd (vacation) homes and high-balance loans more expensive. What is a 2nd home and High-Balance Loans? Sometimes my borrowers confuse 2nd home as the home they buy after they…


